Welcome to my blog, where I will dive into the fascinating world of decision trees.

What are Decision Trees?
Decision trees are hierarchical structures that represent decision paths based on specific attributes or features. At each node of the tree, a decision or attribute is evaluated, leading to subsequent branches and nodes until a final decision is reached at the leaf nodes. This tree-like structure provides a visual representation of decision-making processes, making it easier to understand and analyze complex scenarios.

•Root nodes(decision nodes) are square-shaped and represent a point on the tree at which a decision can be made.
•Internal nodes(chance nodes) are circle-shaped and represent a point on the tree with multiple uncertain consequences.
•Leaf nodes are triangle-shaped and represent the final endpoint of a series of decisions.
Advantages & Disadvantages
Advantages:
- They’re clear and easy to understand.
- They’re quick to design and simple to refine.
- The output can have multiple solutions to any given problem.
- Able to handle both numerical and categorical data.
Disadvantages:
- They are only good if you are backed up with a good amount of data.
- Decision trees can be unstable because a small variation in data may give a completely different result.
- Decision trees are prone to overfitting, especially when a tree is particularly deep.
Illustrative Example

| Buying a house | Low Profit (after selling in 10 years) | High Profit (after selling in 10 years) |
| In Toronto | 30% | 50% |
| In Peterborough | 20% | 40% |
| In Vancouver | 35% | 55% |
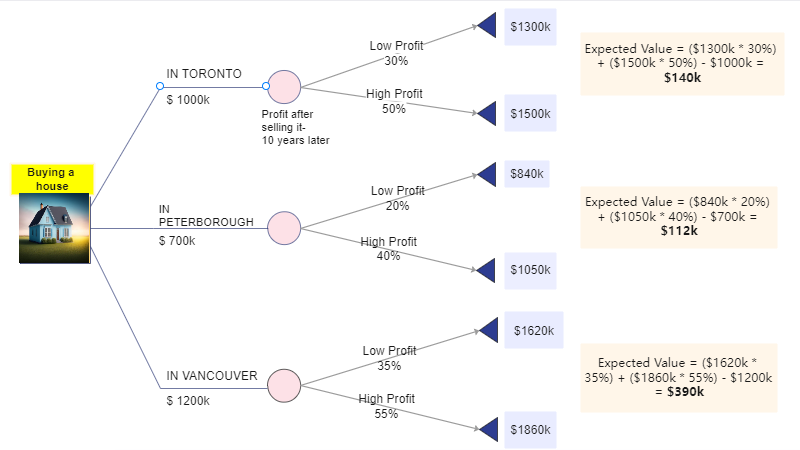
In this example, I am planning to buy a house in Canada in one of the 3 different cities in Canada- Toronto, Peterborough, and Vancouver.
The Current value of buying a 1500 sqft house is different in different cities-
Toronto- $1000k
Peterborough- $700k
Vancouver- $1200k
We are going to use the decision tree analysis to determine which option to choose.
We have calculated the estimated cost of selling through high profit/low profit of all the 3 cities considering that we are going to sell the house after 10 years.
For Toronto:
Expected Value = ($1300k * 30%) + ($1500k * 50%) – $1000k = $140k
For Peterborough:
Expected Value = ($840k * 20%) + ($1050k * 40%) – $700k = $112k
For Vancouver:
Expected Value = ($1620k * 35%) + ($1860k * 55%) – $1200k = $390k
Outcome:-
- Based on estimates through the Decision tree, we have concluded that –
– Buying a house in Vancouver will be more profitable if we consider selling it after 10 years with a profit margin of $390k
PowerPoint Presentation

Good Luck and Lead the way!
References
- Martineau, K. (2022, October 5). What is a Decision Tree? IBM.
https://www.ibm.com/topics/decision-trees - Galinsky, A. (2022, November 30). Decision Tree Examples: Problems With Solutions. IntellSpot.
https://www.intellspot.com/decision-tree-examples/ - Hogarty, S. (2022, September 13). Decision trees: Definition, analysis, and examples. WeWork.
https://www.wework.com/ideas/professional-development/business-solutions/decision-trees-definition-analysis - Asana, T. (2021, December 6). What is decision tree analysis? 5 steps to make better decisions.
Decision Tree Analysis: 5 Steps to Make Better Decisions [2021] • Asana - Project Management Institute. (2017). A Guide to the Project Management Body of Knowledge (PMBOK® Guide) – 6th Edition. 435