
Flow Chart: A blog about the Project management Tool Flow charts
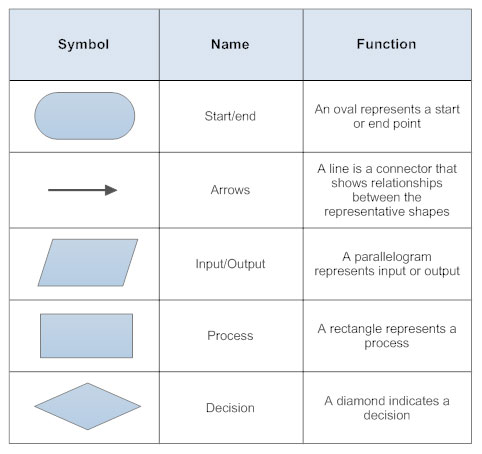
Flow charting is a Graphical way of representing the various steps in the Project life cycle. It can differentiate between decision making steps and other steps by the type of Blocks used for eg: Flow-line, Terminal Blocks, Process Blocks, Decision Blocks, Input/Output Blocks, On-page Connector Blocks. Each of these blocks have their own unique use and can be used to represent some of the common stages in a project lifecycle.
To prepare a flow chart we first need to prepare a rough road map of the project stages using which we decide the general flow of the project. The Picture below shows the usage of each of the commonly used Blocks in a Flow chart.
I’ll tell you about the time that i used flow charts to get an idea for the steps of something I have to do on a weekly bases that’s college assignments. I regularly prepare a rough Flow chat of all the Assignments and Quizzes that are due at the end of each week on Mondays. and then as the week progresses I check off each stage of the flow diagram as i complete each task on the Flow chart. A basic example for one of the assignments is shown below.

I hope the above example helped you better understand how a flow chart can be used in our everyday lives to graphically represent various task to get a clear picture of the various steps in any Process or work. For a better understanding on how flow charts work and how they can be used please take a couple minutes to watch the below attached video.
References:
Also Read the Article By Jose Maria Delos Santos: https://project-management.com/using-flowcharts-in-project-management/
Nice work!
Thank you.
Very helpful!
Thanks 🙂